
DFW Housing Market Update
Spring 2026
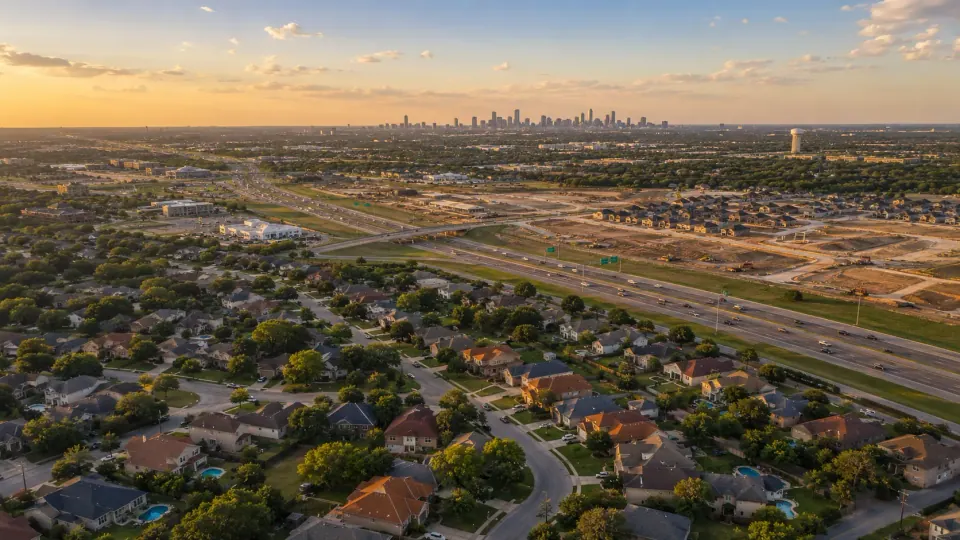
Where the DFW Housing Market Stood in Spring 2026
For the first time in more than a decade, the statewide median for a first quarter came in lower than the year before. The Q1 2026 statewide median was $328,000, down 0.8% from Q1 2025 (Texas REALTORS®, released April 22, 2026). Closed sales rose 0.7% statewide over the same period, while active listings climbed 7.4%. The three previous Q1s saw active-listing increases of more than 30% year-over-year, so the supply build was finally cooling.
DFW was leading the slowdown. Closed sales across the metro fell 6.1% year-over-year in February 2026, the latest reference month from the Texas A&M Real Estate Research Center (TRERC) April 2026 Texas Housing Insight. The Dallas Fed reports DFW existing-home sales were down 6.2% year-over-year in February (Dallas Fed DFW Economic Indicators, April 29, 2026), compared to 1.6% statewide and 1.4% nationally.
Q1 2026 vs Q1 2025: Texas headline numbers
$328K
Statewide median price (Q1 2026, −0.8% YoY)
80 days
Average days on market (+6 vs Q1 2025)
5 mo
Months of inventory (+0.3 vs Q1 2025)
−6.1%
DFW closed sales YoY (Feb 2026)
Average days on market climbed to 80 days statewide, six days longer than the same period last year. Months of inventory was roughly five, what TRERC analysts call a balanced market. None of this is a crash. It is a market settling back down after the early-2020s run-up.
What Mid-May Mortgage Rates Meant for Affordability
The 30-year fixed-rate mortgage averaged 6.36% the week ending May 14, 2026 (Freddie Mac Primary Mortgage Market Survey). That was about 45 basis points lower than a year earlier, when the same survey reported 6.81%. The 15-year fixed was 5.71%. Weekly rates ran between 6.00% and 6.46% from March to mid-May. Freddie Mac's commentary notes: “While purchase demand is softening, it remains above this time last year.”
Affordability is the constraint. UTA real estate economist Sriram Villupuram describes it directly: “Affordability pressures from higher mortgage rates are a major impediment to the DFW housing market. While conditions have improved slightly, mortgage rates remain high compared with pre-2022 levels, limiting buyers' purchasing power and slowing demand” (UTA, March 6, 2026). The headline number is the rate. The practical question is what each 25-basis-point move means for your monthly payment.
What a 25 bps Rate Move Means for Your Monthly Payment
Monthly principal and interest on a $400K home at 80% loan-to-value, across four rate scenarios.
- Mid-May (6.36%) $1,993/mo
- −25 bps (6.11%) $1,941/mo
- −50 bps (5.86%) $1,890/mo
- −100 bps (5.36%) $1,789/mo
A 25 basis-point drop saves about $52 per month on a $320,000 loan. A full point lower, at 5.36%, saves roughly $204 per month, or about $2,450 a year. Those numbers move the qualifying-income math more than they move the home-price ceiling, which is why buyers waiting for a 5% handle on the rate are often the same buyers who later wish they had locked at 6.36% while prices were still negotiable.
Was DFW a Buyer's or Seller's Market in Spring 2026?
The DFW metro was a buyer's market by Redfin's definition. In April 2026, Dallas had an estimated 95.9% more sellers than buyers (16,150 buyers, 31,643 sellers). Fort Worth had 64.9% more sellers than buyers (7,990 vs 13,179). Redfin classifies any market with 10% more sellers than buyers as a buyer's market. Dallas was among the most lopsided buyer's markets in the country.
Two things matter about that number. First, the gap was shrinking. Redfin senior economist Asad Khan: “Homebuyer demand has been dwindling for months, but finally ticked up in April thanks to a strengthening job market and declining recession risk. More house hunters entering the market helped narrow the gap between the number of buyers and sellers” (Redfin, May 12, 2026). Second, the metro headline does not match every neighborhood inside it.
South DFW vs the metro headline
| Market | Months of Supply (Mar 2026) | Read |
|---|---|---|
| Mansfield (LMA) | 3.10 | Seller-leaning |
| Tarrant County | 3.30 | Seller-leaning |
| Ellis County | 4.40 | Balanced |
| Texas statewide | ~5.0 | Balanced (TRERC threshold) |
| Dallas metro (buyer-seller ratio) | 95.9% excess sellers | Buyer's market (Redfin) |
Sources: TRERC Mansfield LMA, TRERC Tarrant + Ellis County housing activity, Redfin.
In March 2026, Mansfield was still the seller side of the spectrum at 3.10 months of supply. Ellis County was closer to balance at 4.40. The South DFW cities Modern Feather covers do not look like one number. They look like three different numbers. For the opposite end of the metro, see how North DFW is correcting.
South DFW Spotlights: Mansfield, Midlothian, Waxahachie
Three South DFW cities, three different stories. Mansfield was still tight. On Zillow’s home value index, Midlothian dipped least (−1.05%, vs −1.91% for Mansfield and −2.23% for Waxahachie), and Waxahachie was the value play. Each spotlight pulls city-level data from the best available source: TRERC's Mansfield Local Market Area for Mansfield, and Zillow's Home Value Index with TRERC Ellis County context for Midlothian and Waxahachie (TRERC does not publish a city-level LMA for those two; full disclosure in the methodology section).
Mansfield: a snapshot
Mansfield closed 99 sales in March 2026 at a median price of $473,000, up 3.08% year-over-year (TRERC Mansfield LMA). That puts Mansfield above the statewide median by about $145,000. The market was still seller-leaning: 3.10 months of inventory was below TRERC's balanced-market threshold of four to five months.
The story underneath the median is the three-county tax structure. Mansfield sits across Tarrant, Ellis, and Johnson counties, each with different effective property tax rates. Depending on which county a Mansfield home sits in, the 2026 combined rate runs about $1.94 to $2.25 per $100. The Ellis County part is in Midlothian ISD, and a $500,000 homestead there pays about $1,560 a year less than one on the Tarrant or Johnson side.
Most of Mansfield is in Mansfield ISD, but the Ellis County part of the city is in Midlothian ISD. The Tarrant County rollup tells the broader story: 3.30 months of inventory, median price $349,000 (+0.69% YoY in March 2026). Tarrant overall was softer than Mansfield specifically.
Silvia's most recent Mansfield close: 2501 Blossom Trail, $395,000 (buyer side, closed May 2026).
Talk to Silvia about the Mansfield marketMidlothian: a snapshot
Midlothian's Zillow Home Value Index was $453,006 as of March 31, 2026, down 1.05% year-over-year. That was the mildest decline of the three cities profiled here (Zillow ZHVI City CSV). That puts Midlothian's index about $12,000 above Mansfield's, while Mansfield's LMA closed-sale median ran about $20,000 above Midlothian's index in March. Two different measures, similar price points.
The county frame matters here because TRERC does not publish a city-level LMA for Midlothian. Ellis County's median closed-sale price was $426,500 in March 2026, up 7.04% year-over-year (TRERC Ellis County housing activity). The county had 4.40 months of inventory and 1,279 active listings end-of-month. Silvia represents buyers and sellers across Ellis County, including Midlothian.
Waxahachie: a snapshot
Waxahachie's Zillow ZHVI was $371,114 as of March 31, 2026, down 2.23% year-over-year. That was the steepest decline of the three cities profiled here (Zillow ZHVI City CSV). That puts Waxahachie roughly $82,000 below Midlothian on the same index and about $70,000 below Mansfield's ZHVI ($441,244 per Zillow). The value-play angle held up in the data: same county, lower entry price.
The county frame is the same one that applies to Midlothian. Ellis County posted a $426,500 median closed-sale price in March 2026 (+7.04% YoY), with 4.40 months of inventory and 318 closed sales (+4.61% YoY) per TRERC's housing activity report. Waxahachie has six historic districts. Silvia represents buyers and sellers across Ellis County, including Waxahachie.
What's Actually Driving the Spring 2026 Market
The DFW slowdown was not happening because the local economy was breaking. It was happening because mortgage rates were higher than buyers wanted them to be, and supply had finally caught up after three years of explosive growth in active listings.
The Dallas Fed's DFW Economic Indicators report from April 29, 2026 shows the labor side was still strong: unemployment 3.9% in February (below Texas at 4.3%; the U.S. rate was 4.3% in March), average hourly earnings $37.28 (up 2.6% year-over-year and above the Texas figure of $35.00), job growth 1.6% annualized over the three months ending in February. The jobs were there. Wages were higher than the state average. The friction was on the housing side, not the economy side.
Three forces shaping spring 2026
Rate fatigue
The 30-year fixed had stayed in the 6.3-7.0% band for most of the two years to mid-May 2026. Buyers who held out for a 5% handle saw one only briefly: the weekly average touched 5.98% on February 26, 2026, was back at 6.00% the next week and stayed at or above that through mid-May.
Inventory finally caught up
Statewide active listings in Q1 2026 were 7.4% higher than Q1 2025 (Texas REALTORS®). That sounds like a lot, but the three previous Q1s had +30% or more. Supply was rising; the rate of increase was slowing.
Seller price cuts are normal again
The median Texas seller cut $16,900 off list (4.9%) before closing in February 2026, up from $14,900 (4.2%) a year ago (TRERC).
Layered on top of those is a piece TRERC named directly in its April 2026 Insight: geopolitics. Yanling Mayer wrote that “the economic impact from geopolitical instability is reshaping the trajectory of the spring housing market” (TRERC, April 30, 2026). The practical version of that observation: when uncertainty rises, buyers wait at the start of the season and sellers still try to price for the spring lift. The two sides do not meet, and days on market go up.
What Economists and Texas A&M Are Saying
Three primary sources are tracking the same shift from different angles. Their wording matters because it tells you what to plan around.
“The economic impact from geopolitical instability is reshaping the trajectory of the spring housing market. Before the recent geopolitical conflicts and escalations, expectations were building for a more active and balanced housing market this spring.”
— Yanling Mayer, Texas A&M Real Estate Research Center, Texas Housing Insight, April 2026
“In the early 2020s, we went from steady price appreciation statewide to something more dramatic. And there was an outsized effect in the largest metros. But the changes were never uniform. The real estate market can look very different depending on the city or even the neighborhood you're standing in.”
— Jennifer Wauhob, Chairman of Texas REALTORS®, Q1 2026 release
The UTA forecast adds a price-trajectory call to the same picture. Sriram Villupuram pinned it to specific drivers and a specific window.
“The DFW housing market is transitioning from a frenzied seller's market to a more balanced — but slower — environment. Home values fell around 5% in 2025, with broad softening across most counties. Looking ahead, prices will likely remain flat or decline slightly through mid-2026 due to high interest rates and slower economic growth.”
— Sriram Villupuram, Associate Professor of Finance and Real Estate, University of Texas at Arlington, March 6, 2026
What to Expect Heading into Summer 2026
Three things are likely to define the South DFW market through the back half of spring and into summer.
1. Prices stay flat or drift down a little. The UTA forecast above is the cleanest version of this: prices will likely remain flat or decline slightly through mid-2026. Through February 2026, Texas A&M's price index was in its ninth consecutive month of small year-over-year declines (TRERC April 2026 Insight), and the pace had held steady in the 0.6-0.7% range. That is a soft landing, not a collapse.
2. Days on market stay elevated. The Texas average was 80 days for Q1 2026, six days longer than the same quarter last year. The April Insight notes February statewide DOM hit 82 days, the first time since February 2013 the figure crossed 80. Sellers who price for 2022 will sit. Sellers who price to where buyers actually are will move.
3. Buyers gain real negotiation room. Median seller price cuts ran $16,900 or 4.9% off list in February, up from $14,900 (4.2%) a year ago. The buy-side leverage is real, but it is not unlimited. It is concentrated on the homes that have been sitting longer than the local average.
There is no inventory explosion coming. Active listings statewide were up 7.4% year-over-year in Q1 2026. That was meaningful, but a fraction of the 30%+ year-over-year jumps the three previous Q1s saw. The supply build was finally slowing.
If You're Selling vs If You're Buying This Spring
If you're selling
- Price for today, not 2022. The median Texas seller cut 4.9% off list before closing in February. Pricing 4-5% above the comparable sale next door is no longer a strategy; it is the path to 80+ days on market.
- Plan for 70-90 days, not 14. Statewide DOM was 80 days in Q1, and the DFW metro averaged 75 (Texas REALTORS®, Q1 2026).
- Pre-list inspect. Buyers in this market walk away over repair items they would have overlooked in 2022. Surface and fix the major items before listing.
- Expect to negotiate concessions. Rate buy-downs, closing-cost contributions, and home-warranty add-ons are common asks. Median Texas price cuts ran $16,900 (4.9%) in February.
If you're buying
- Get pre-approved at today's rate, not the rate you wish for. 6.36% was the working number in mid-May 2026. If a 5% scenario opens up, refinance. Do not skip a house because you are waiting on the Fed.
- Ask for the rate buy-down. Builders and motivated sellers offer 2-1 buy-downs and permanent rate buy-downs. Make it part of the offer.
- Use the days-on-market signal. Homes that have sat well past the local average are the ones where price cuts and concessions land hardest. Filter your search by DOM.
- Run the county-line math. A $500,000 Mansfield homestead pays about $1,560 a year less in property tax on the Ellis County side, which is in Midlothian ISD, than in Tarrant or Johnson County. Ask your agent to pull the exact effective rate before you write the offer.
The market is bifurcated, but the playbook is the same for both sides: trust the numbers in front of you, not the headlines about national real estate. Mansfield is not Dallas. Ellis County is not Tarrant. A trained agent who pulls the right comps for the right county is the difference between a smooth close and a 90-day grind.
Methodology + Sources
Every number on this page traces to a published primary source. Sources used are listed below.
Sources used
- Texas A&M University Real Estate Research Center (TRERC) (statewide and city-level housing activity). Texas Housing Insight April 2026, Mansfield LMA, and TRERC Ellis County + Tarrant County housing activity data.
- Texas REALTORS® Q1 2026 Quarterly Housing Report (statewide Q1 totals). Released April 22, 2026.
- Freddie Mac Primary Mortgage Market Survey (30-year fixed mortgage rate). Week ending May 14, 2026.
- Redfin News, Buyers vs Sellers (April 2026) (metro-level buyer-seller imbalance). Published May 12, 2026.
- Zillow Home Value Index (ZHVI) (city-level home value index for Midlothian and Waxahachie). As of March 31, 2026.
- Federal Reserve Bank of Dallas (DFW economic indicators: jobs, unemployment, wages, existing-home sales). April 29, 2026 issue.
- University of Texas at Arlington (expert quote from Sriram Villupuram, Associate Professor of Finance and Real Estate). UTA News, March 6, 2026.
Per-city sourcing note
Mansfield: City-level statistics come from the TRERC Mansfield Local Market Area report. County context: TRERC Tarrant County housing activity. The LMA dataset does not publish days-on-market, so DOM references throughout this article are statewide figures from Texas REALTORS® and the TRERC Texas Housing Insight.
Midlothian and Waxahachie: TRERC does not publish a city-level market area for Midlothian or Waxahachie. City-level statistics come from the Zillow Home Value Index (ZHVI) as of March 31, 2026. County-level context for both cities comes from TRERC Ellis County housing activity. Different measures and different methodologies. The per-city stat cards label which source they pull from.
TRERC and Zillow revise recent months; the March 2026 figures in this report were updated to their revised values on November 5, 2026. The property tax examples use 2026 tax rates checked the same day, which were adopted after this report was first published.
Frequently Asked Questions
Are home prices dropping in DFW?
In spring 2026, yes. The statewide Texas median dropped 0.8% year-over-year in Q1 2026, the first time in more than ten years that a first-quarter median came in below the year before (Texas REALTORS®). Across the DFW metro, the Texas A&M Real Estate Research Center recorded a 6.1% drop in closed sales in February 2026. Prices were softening, not crashing.
Is it wise to buy a home in DFW in 2026?
For buyers who can afford the rate, yes. The Dallas metro had 95.9% more sellers than buyers (Redfin, April 2026), which means real negotiation room: price cuts, closing-cost help, repair credits. Mortgage rates near 6.36% were the constraint. If you can carry the payment, you have leverage sellers haven't seen in years.
How much income do I need to afford a $400K home in DFW?
At the May 14, 2026 rate of 6.36%, a $400,000 home with 20% down ($320,000 principal) carries roughly $1,993 in monthly principal and interest, before taxes and insurance. If a lender caps housing costs at 28% of gross income, that payment alone needs about $85,000 a year, and property taxes and homeowners insurance raise it.
Will DFW home prices crash in 2026?
A crash is unlikely. The DFW economy was still adding jobs: 1.6% annualized over the three months ending in February (Dallas Fed). Unemployment was 3.9% in February, below Texas's 4.3%. UTA economist Sriram Villupuram forecasts prices will stay flat or decline slightly through mid-2026, not collapse. Soft, not broken.
What's the housing market forecast for Texas in 2026?
Through February 2026, Texas was in its ninth consecutive month of small year-over-year price declines (Texas A&M Real Estate Research Center, April 2026 Texas Housing Insight). In February, the statewide median was $325,000, down 1.0% YoY, and months of supply was 4.8, roughly balanced. Expect more of the same: softer pricing, longer days on market, more negotiation room.
Was DFW a buyer's or seller's market in spring 2026?
By Redfin's measure the DFW metro was a buyer's market in April 2026: Dallas had 95.9% more sellers than buyers and Fort Worth 64.9% more. South DFW was mixed. Mansfield's months of supply was 3.10 in March 2026, below the four to five months TRERC analysts call balanced, so still seller-leaning. The metro headline and the South DFW picture were not the same.
When will mortgage rates come down?
No one knows. The 30-year fixed averaged 6.36% the week of May 14, 2026, down from 6.81% a year earlier (Freddie Mac). Plan around the rate you can lock, not on a drop.
Talk to a South DFW Specialist